

Marcus Butler
29 November 2017: Disease mapping is being used as a modern tool for identifying risks and informing public health policy, but researchers at the University of Canberra say the real story of socio-economic disadvantage and disease is often hidden.
University of Canberra Health Research Institute (HRI) research shows that often the wrong geographical scale is being used for disease mapping which obscures the statistical associations of risks and health outcomes.
These findings are part of HRI’s Impact of scale of aggregation on associations of cardiovascular hospitalization and socio-economic disadvantage report which has been published in the journal PLOS One.
HRI’s data scientist and lead author of the report Dr Ivan Hanigan said that in order to protect the anonymity of health data, government authorities prefer large scale mapping, which impacts the evidence they need for policy responses. “It has left them with little detail and a picture that doesn’t reflect reality,” he said.
“The salt-and-pepper approach to Canberra’s public housing and high-density living, which means low socio-economic groups are spread out throughout the city’s suburbs, hides the disadvantage when studied at certain scales. Current disease mapping often shows a uniform level of health problems at suburb level or above, but by drilling it down to a smaller, neighbourhood level you begin to see a very different story."
Dr Hanigan said it is globally well known that socio-economic disadvantage is associated with more heart disease problems.
“Being able to peer down at street-level maps of disadvantage can reveal these pockets of very high risk, right in the middle of some of our more affluent suburbs.
-
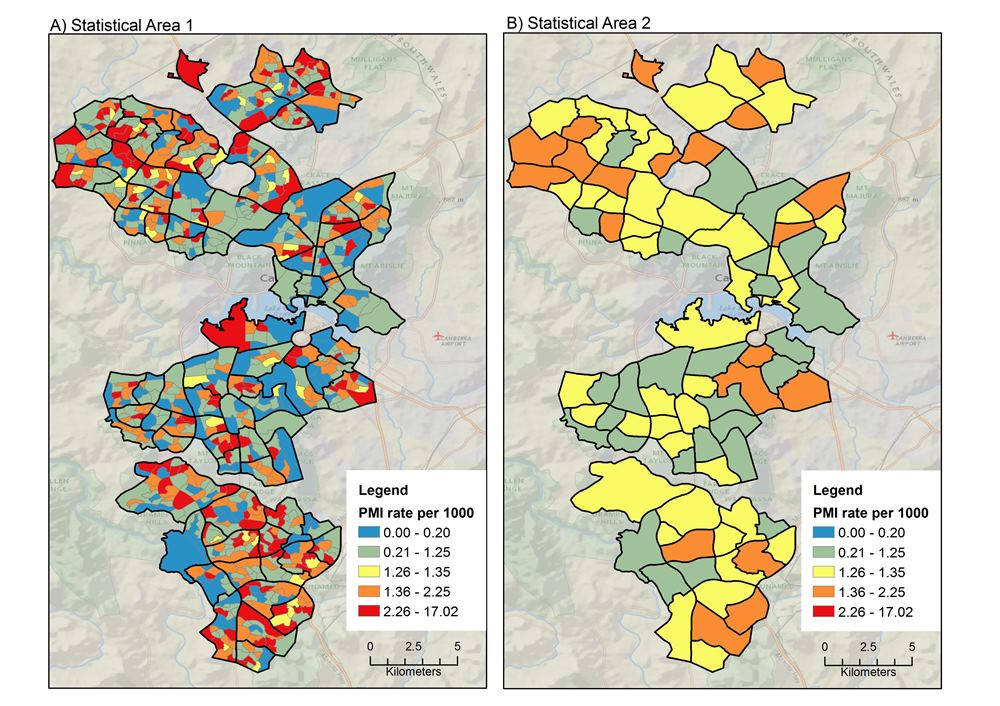 Statistical maps of Canberra and the ACT showing rates of heart attack at low scale (right) and high scale (left) reveal the disparity in data which is used to drive public health policy and interventions. Image credit: Hanigan, I. Cochrane, T. and Davey, R.

“Health data administrators are restricted by certain interpretations of privacy laws and this has unintentionally led to the suppression of data access by researchers. Our ability to make adequate disease maps and do correlation analysis is then hampered,” Dr Hanigan said.
“A lot of money is being spent on data collection and this needs to be better used to improve public health, especially risk identification and prevention. There is a trade-off between the public health benefits of geographical research on health versus the protection of individual privacy.”
The study examined low scale statistical areas and compared them with larger scale areas to uncover the differences in risk factors and health problems. Dr Hanigan said they found that rates of heart attack hospitalisation had distinct peaks and troughs across most suburbs when using low scale analysis.
“When we examined the same areas at larger scale, we found those peaks and troughs largely disappeared becoming far smoother across these suburbs. In some cases, these suburb-level results were four times lower than the rates seen in low scale analysis.
“It’s clear that the scale of analysis can change the understanding of geographical patterns of risk factors and diseases. This needs to be taken into account in planning future health data analysis, and when health authorities and the government review the evidence and work on population health policies,” Dr Hanigan said.
The report was co-authored by University of Canberra Professor of Public Health Tom Cochrane and HRI Director Professor Rachel Davey.